Memory inefficiency: s platform-level memory stranding
Current cloud vendor try on memory disaggregation: require no modifications to
customer workloads or the guest OS./ the system
must be compatible with virtualization acceleration techniques/ the system must be available as
commodity hardware.
Nvidia has a lot of talented architects, like Michael Andersch and Gregg Palmer, to design GPU. But Grace is just a glued arm GPU, shameful! But I don't think the idea of launching Grace is just an armv9 CPU, Nvidia has integrated TEE, CCA, UCIe into the CPU, and NVLink C2C, which is great. Nvidia is for real good at turning all the tech into business.
The paper is joined work between my upperclassman Jian Zhang who's currently taking Ph.D. at Rutgers.
Current Hw-Sw co-design
Hardware Trend
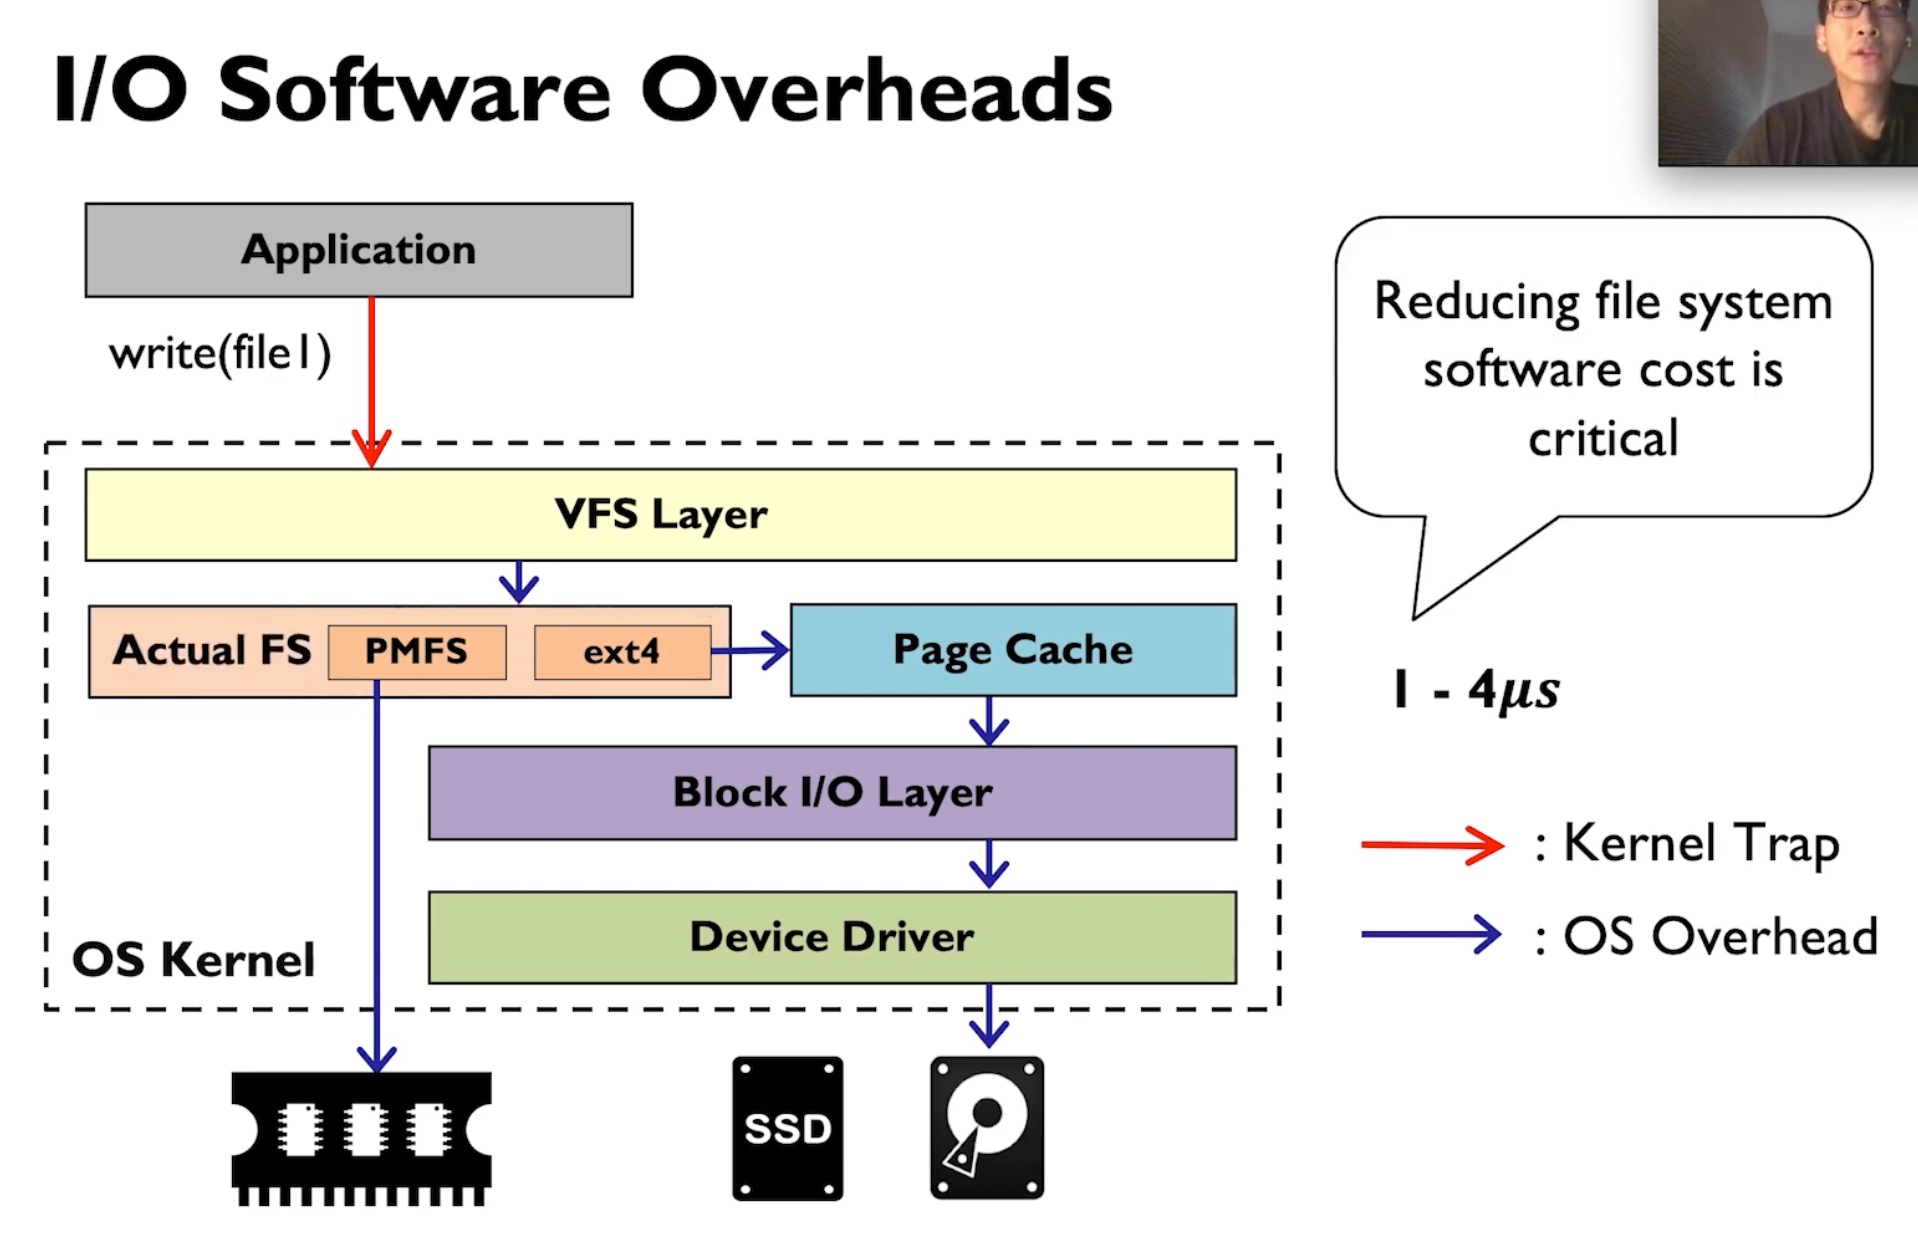
Design a fast path to reduce latency.
Software Trend
Do kernel bypass/zero-copy
Good
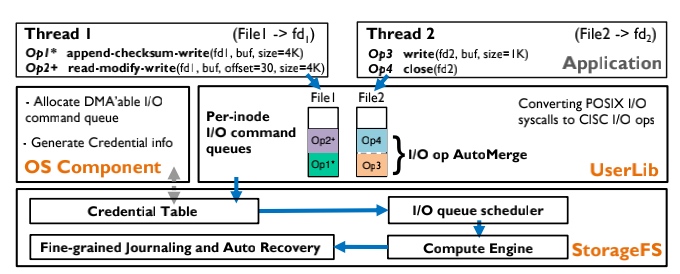
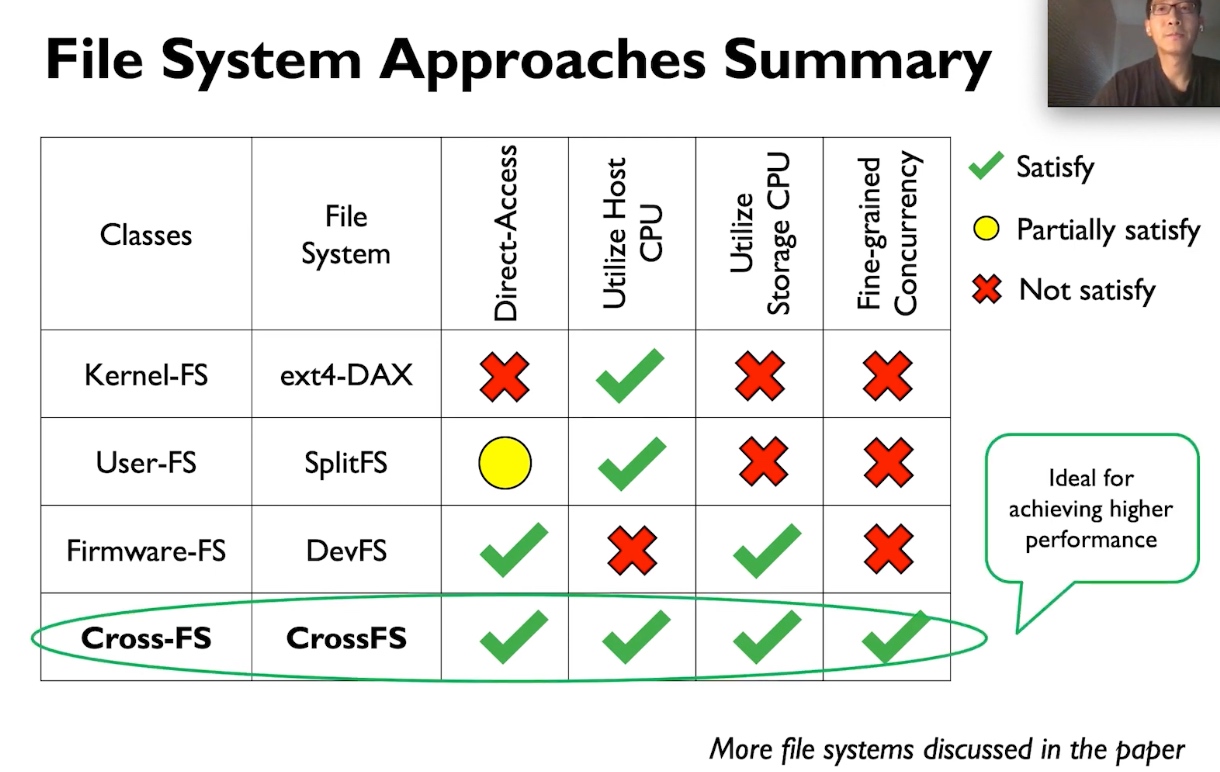
FusionFS comes up with aggregated I/O ops into $CISC_{Ops}$, the fuses and offloads data ops are carried out on the co-processor on storage. These higher throughputs are gained with assurance to the resource management fairness, crash consistency, and fast recovery.
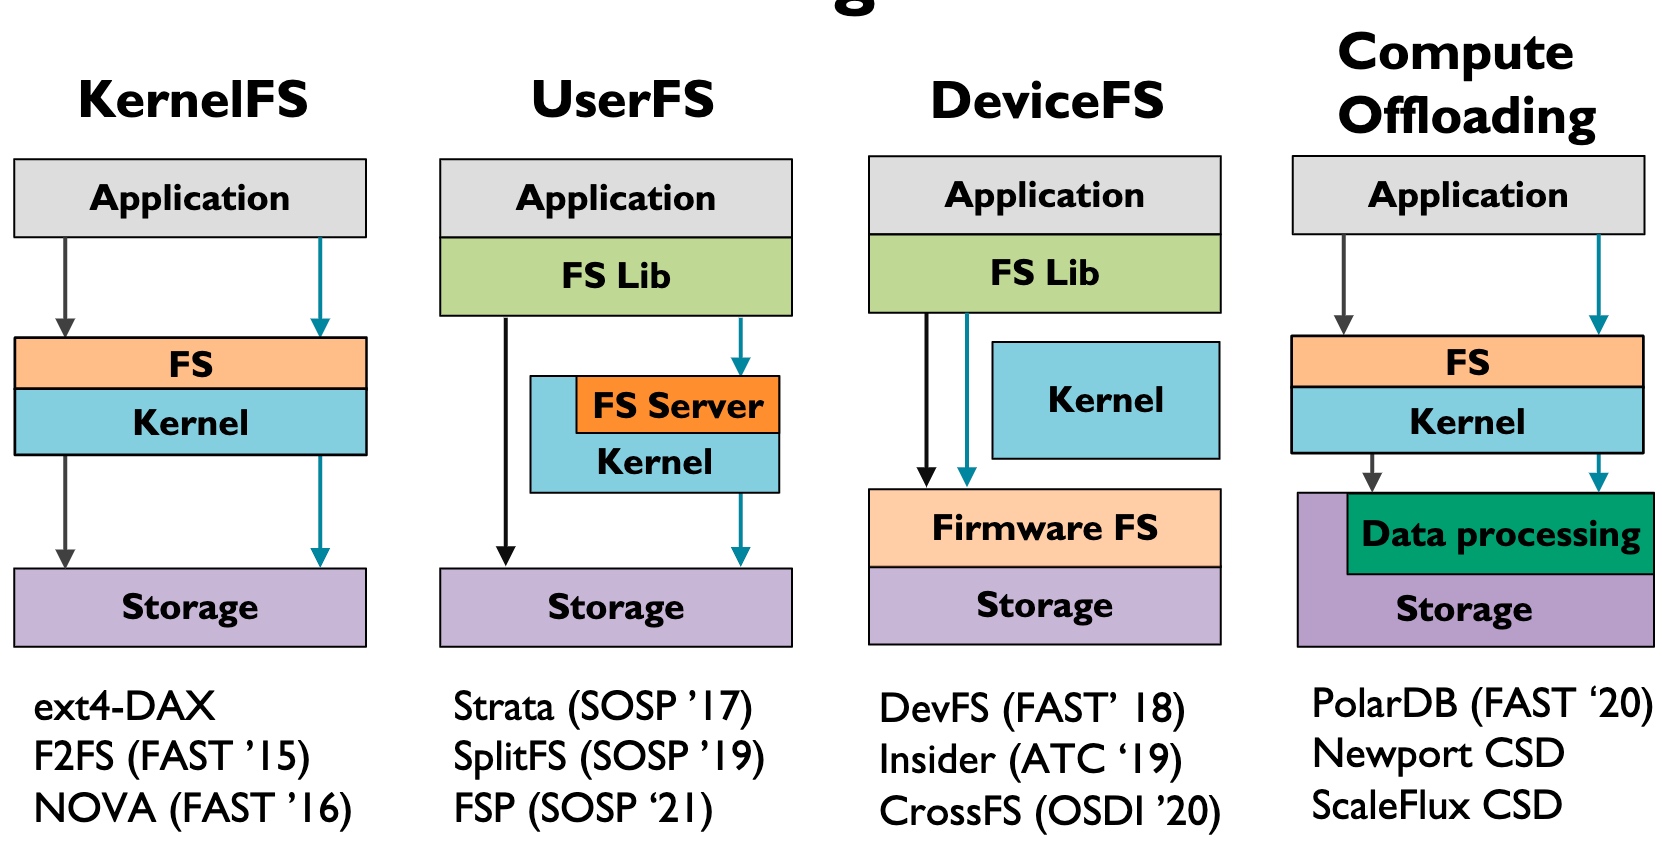
Kernel FS pushes all the W/R to the VFS Layer, this does not necessarily mean it's slow, often the time waiting for heavy-weighted Writeback, page cache is not hit, I/O queue locks waiting for the device ready, or deep VFS calls.
User FS may have some of the W/R intercepted and bypass the kernel. Some of the userspace semantic fusion is implemented using FUSE.
Device FS(Before CrossFS is Firmware FS) makes FS Lib directly call the firmware to wait until it can make DMA to memory.
Good for Disaggregation & Concurrency throughput
Mainly for NVM when speed is high, not applicable to SSDs
This paper used Compute Offloading, which is greatly applied in the SMartNIC. Storage plus the data processing makes transparent to the kernel, the kernel only needs to know some of the results is fused.
write fusion
read fusion
data replacement for locality
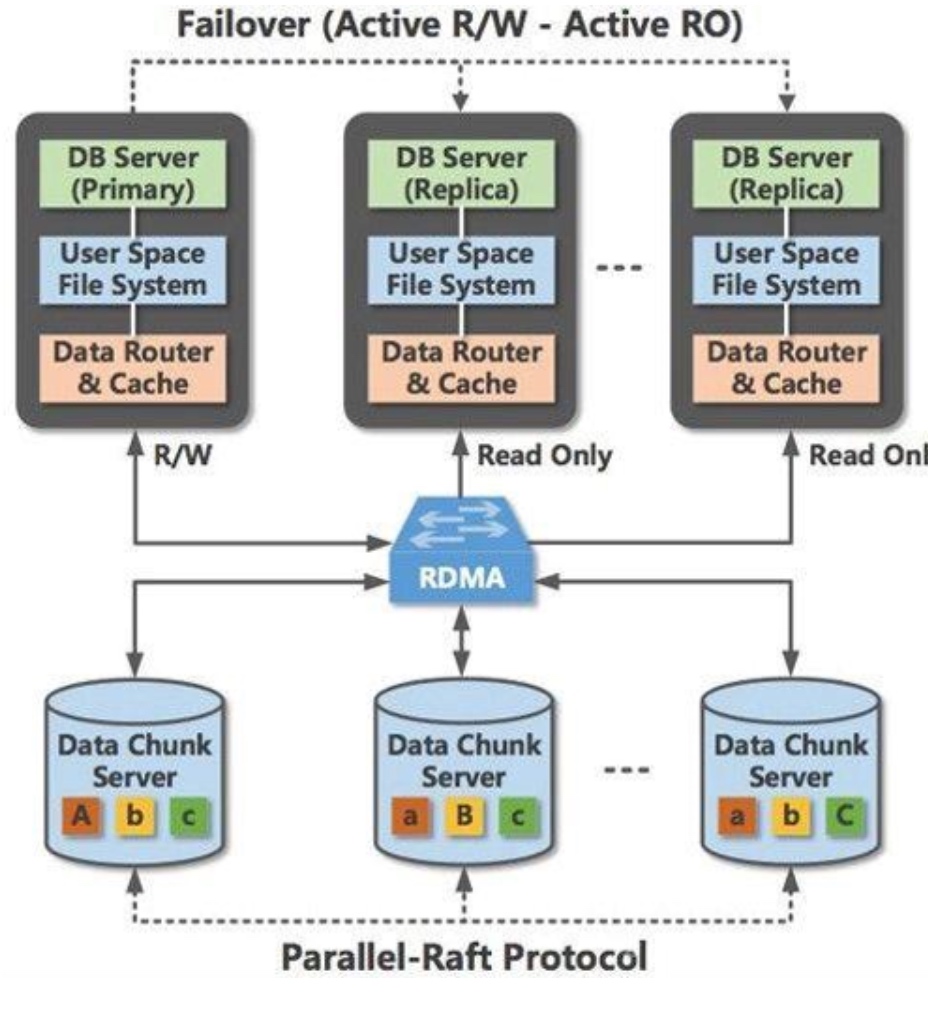
PolarDB - PCIe layer compute offloading. I think it could be replaced by CXL.
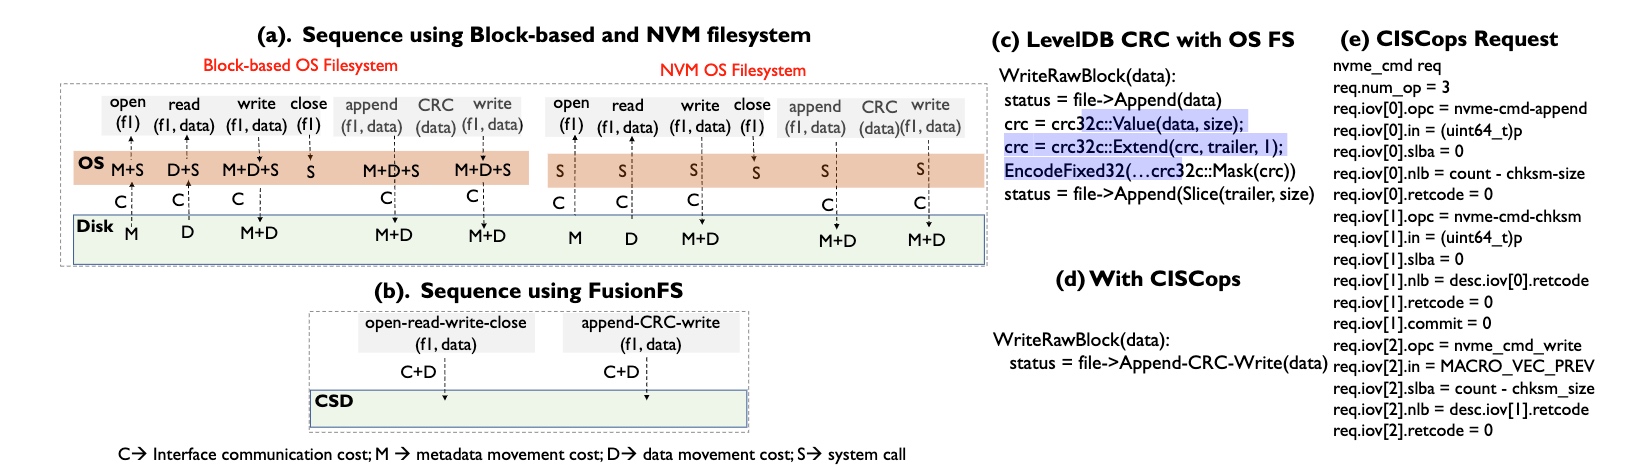
crc-append interpreted into CISCops Basically, based on the predefined rules, the co-processor is able to fuse most of the data operations like LevelDB CRC, open read-write close.
CFS I/O scheduling.
Durability maintained by Micro Tx.
Bad
Large sequential data read/write will introduce preprocessor overhead, at least for data calculation and buffer store. Can pattern matching and make bypass the data processing.
This paper shared a lot of similar designs with CrossFS for resource management, durability, and Permission checks.
I'm curious why not implement the SSD main controller? It's meaningless to write on NVM because programmers must do handmade I/O fusion on such devices.
Performance is roughly the same with NOVA when with slow device CPU. I don't know if IO thread affinity and other kernel optimization are applied, the additional hardware has real benefits. However, the recovery speed is really quick because of MicroTx.
Refinement
Still could apply kernel bypass over the FusionFS.
SSD main controller/ Memory controller implementation is better than adding another CPU.
Reference
POLARDB Meets Computational Storage: Efficiently Support AnalyticalWorkloads in Cloud-Native Relational Database
CrossFS: A Cross-layered Direct-Access File System
When we are running DeepMD on our machines, we encountered that NCCL will stuck for multicard communication. We consult on this link & this link and disable both SVM and IOMMU resolve the problem
admin@ubuntu_1604:~/sniper/test/lab0$ make
../../run-sniper -c ./config-lab0.cfg -- ./toy-lab0
[SNIPER] Warning: Unable to use physical addresses for shared memory simulation.
[SNIPER] Start
[SNIPER] --------------------------------------------------------------------------------
[SNIPER] Sniper using SIFT/trace-driven frontend
[SNIPER] Running full application in DETAILED mode
[SNIPER] --------------------------------------------------------------------------------
[SNIPER] Enabling performance models
[SNIPER] Setting instrumentation mode to DETAILED
[RECORD-TRACE] Using the Pin frontend (sift/recorder)
User program begins
<toy-lab0.c, clflush, 21> clflush to be run
[[email protected], iterate, 311] CLFLUSH instruction executed
<toy-lab0.c, clflush, 21> clflush to be run
[[email protected], iterate, 311] CLFLUSH instruction executed
<toy-lab0.c, clflush, 21> clflush to be run
[[email protected], iterate, 311] CLFLUSH instruction executed
<toy-lab0.c, clflush, 21> clflush to be run
[[email protected], iterate, 311] CLFLUSH instruction executed
User program ends
[TRACE:0] -- DONE --
[SNIPER] Disabling performance models
[SNIPER] Leaving ROI after 2.83 seconds
[SNIPER] Simulated 0.0M instructions, 0.1M cycles, 0.36 IPC
[SNIPER] Simulation speed 11.9 KIPS (11.9 KIPS / target core - 84229.9ns/instr)
[SNIPER] Setting instrumentation mode to FAST_FORWARD
[SNIPER] End
[SNIPER] Elapsed time: 3.06 seconds


Optional: Run '../../tools/cpistack.py' in this directory to generate cpi-stack output for this run
Optional: Run '../../tools/mcpat.py' in this directory to generate power output for this run
Optional: Run '../../tools/dumpstats.py' in this directory to view detailed statistics for this run
Optional: Run '../../tools/gen_topology.py' in this directory to view the system topology for this run
if(ins->opcode==4542892)
      fprintf(stderr, "[[email protected], %s, %d] clflush to be run\n",  __func__, __LINE__);
Introduction
The Sniper simulator allows one to perform timing simulations for both multi-program workloads and multi-threaded, shared-memory applications with 10s to 100+ cores. The maintainer is a researcher at NUS, Cambridge, Intel, and Ghent University.
Cache implementation
We have the cfg for the cache. So I consult their dispatch process in the source code.
# Configuration file for the Sniper simulator

# This file is organized into sections defined in [] brackets as in [section].
# Sections may be hierarchical withsub-sections split by the '/' character as
# in [section/sub_section].
#
# values can be "strings" , numbers, or true/false, existing values
# should indicate the type

# This section controls various high-level simulation parameters.
[general]
magic = false # Enable performance simulation straight away (false), or wait for Roi{Begin,End} magic instruction (true)
roi_script = false # Allow ROI to be set by a script, and ignore Roi{Begin,End} magic instructions
inst_mode_init = cache_only
inst_mode_roi = detailed
inst_mode_end = fast_forward
inst_mode_output = true
syntax = intel # Disassembly syntax (intel, att or xed)
issue_memops_at_functional = false # Issue memory operations to the memory hierarchy as they are executed functionally (Pin front-end only)
num_host_cores = 0 # Number of host cores to use (approximately). 0 = autodetect based on available cores and cpu mask. -1 = no limit (oversubscribe)
enable_signals = false
enable_smc_support = false # Support self-modifying code
enable_pinplay = false # Run with a pinball instead of an application (requires a Pin kit with PinPlay support)
enable_syscall_emulation = true # Emulate system calls, cpuid, rdtsc, etc. (disable when replaying Pinballs)
suppress_stdout = false # Suppress the application's output to stdout
suppress_stderr = false # Suppress the application's output to stderr

# Total number of cores in the simulation
total_cores = 64

enable_icache_modeling = false

# This section is used to fine-tune the logging information. The logging may
# be disabled for performance runs or enabled for debugging.
[log]
enabled = false
stack_trace = false
disabled_modules = ""
enabled_modules = ""
mutex_trace = false
pin_codecache_trace = false
circular_log = false

[progress_trace]
enabled = false
interval = 5000
filename = ""

[clock_skew_minimization]
scheme = barrier
report = false

[clock_skew_minimization/barrier]
quantum = 100                         # Synchronize after every quantum (ns)

# This section describes parameters for the core model
[perf_model/core]
frequency = 1        # In GHz
type = oneipc        # Valid models are oneipc, interval, rob
logical_cpus = 1     # Number of SMT threads per core

[perf_model/core/interval_timer]
#dispatch_width = 4
#window_size = 96
issue_contention = true
num_outstanding_loadstores = 8
memory_dependency_granularity = 8 # In bytes
lll_dependency_granularity = 64 # In bytes. Model the MSHR for overlapping misses by adding additional dependencies on long-latency loads using cache-line granularity
lll_cutoff = 30
issue_memops_at_dispatch = false # Issue memory operations to the cache hierarchy at dispatch (true) or at fetch (false)

# This section describes the number of cycles for
# various arithmetic instructions.
[perf_model/core/static_instruction_costs]
add=1
sub=1
mul=3
div=18
fadd=3
fsub=3
fmul=5
fdiv=6
generic=1
jmp=1
string=1
branch=1
dynamic_misc=1
recv=1
sync=0
spawn=0
tlb_miss=0
mem_access=0
delay=0
unknown=0

[perf_model/branch_predictor]
type=one_bit
mispredict_penalty=14 # A guess based on Penryn pipeline depth
size=1024

[perf_model/tlb]
# Penalty of a page walk (in cycles)
penalty = 0
# Page walk is done by separate hardware in parallel to other core activity (true),
# or by the core itself using a serializing instruction (false, e.g. microcode or OS)
penalty_parallel = true

[perf_model/itlb]
size = 0              # Number of I-TLB entries
associativity = 1     # I-TLB associativity

[perf_model/dtlb]
size = 0              # Number of D-TLB entries
associativity = 1     # D-TLB associativity

[perf_model/stlb]
size = 0              # Number of second-level TLB entries
associativity = 1     # S-TLB associativity

[perf_model/l1_icache]
perfect = false
passthrough = false
coherent = true
cache_block_size = 64
cache_size = 32 # in KB
associativity = 4
address_hash = mask
replacement_policy = lru
data_access_time = 3
tags_access_time = 1
perf_model_type = parallel
writeback_time = 0    # Extra time required to write back data to a higher cache level
dvfs_domain = core    # Clock domain: core or global
shared_cores = 1      # Number of cores sharing this cache
next_level_read_bandwidth = 0 # Read bandwidth to next-level cache, in bits/cycle, 0 = infinite
prefetcher = none

[perf_model/l1_dcache]
perfect = false
passthrough = false
cache_block_size = 64
cache_size = 32 # in KB
associativity = 4
address_hash = mask
replacement_policy = lru
data_access_time = 3
tags_access_time = 1
perf_model_type = parallel
writeback_time = 0    # Extra time required to write back data to a higher cache level
dvfs_domain = core    # Clock domain: core or global
shared_cores = 1      # Number of cores sharing this cache
outstanding_misses = 0
next_level_read_bandwidth = 0 # Read bandwidth to next-level cache, in bits/cycle, 0 = infinite
prefetcher = none

[perf_model/l2_cache]
perfect = false
passthrough = false
cache_block_size = 64 # in bytes
cache_size = 512 # in KB
associativity = 8
address_hash = mask
replacement_policy = lru
data_access_time = 9
tags_access_time = 3  # This is just a guess for Penryn
perf_model_type = parallel
writeback_time = 0    # Extra time required to write back data to a higher cache level
dvfs_domain = core    # Clock domain: core or global
shared_cores = 1      # Number of cores sharing this cache
prefetcher = none     # Prefetcher type
next_level_read_bandwidth = 0 # Read bandwidth to next-level cache, in bits/cycle, 0 = infinite

[perf_model/l3_cache]
perfect = false
passthrough = false

[perf_model/l4_cache]
perfect = false
passthrough = false

[perf_model/llc]
evict_buffers = 8

[perf_model/fast_forward]
model = oneipc        # Performance model during fast-forward (none, oneipc)

[perf_model/fast_forward/oneipc]
interval = 100000     # Barrier quantum in fast-forward, in ns
include_memory_latency = false # Increment time by memory latency
include_branch_misprediction = false # Increment time on branch misprediction

[core]
spin_loop_detection = false

[core/light_cache]
num = 0

[core/cheetah]
enabled = false
min_size_bits = 10
max_size_bits_local = 30
max_size_bits_global = 36

[core/hook_periodic_ins]
ins_per_core = 10000  # After how many instructions should each core increment the global HPI counter
ins_global = 1000000  # Aggregate number of instructions between HOOK_PERIODIC_INS callbacks

[caching_protocol]
type = parametric_dram_directory_msi
variant = mesi                            # msi, mesi or mesif

[perf_model/dram_directory]
total_entries = 16384
associativity = 16
max_hw_sharers = 64                       # number of sharers supported in hardware (ignored if directory_type = full_map)
directory_type = full_map                 # Supported (full_map, limited_no_broadcast, limitless)
home_lookup_param = 6                     # Granularity at which the directory is stripped across different cores
directory_cache_access_time = 10          # Tag directory lookup time (in cycles)
locations = dram                          # dram: at each DRAM controller, llc: at master cache locations, interleaved: every N cores (see below)
interleaving = 1                          # N when locations=interleaved

[perf_model/dram_directory/limitless]
software_trap_penalty = 200               # number of cycles added to clock when trapping into software (pulled number from Chaiken papers, which explores 25-150 cycle penalties)

[perf_model/dram]
type = constant                           # DRAM performance model type: "constant" or a "normal" distribution
latency = 100                             # In nanoseconds
per_controller_bandwidth = 5              # In GB/s
num_controllers = -1                      # Total Bandwidth = per_controller_bandwidth * num_controllers
controllers_interleaving = 0              # If num_controllers == -1, place a DRAM controller every N cores
controller_positions = ""
direct_access = false                     # Access DRAM controller directly from last-level cache (only when there is a single LLC)

[perf_model/dram/normal]
standard_deviation = 0                    # The standard deviation, in nanoseconds, of the normal distribution

[perf_model/dram/cache]
enabled = false

[perf_model/dram/queue_model]
enabled = true
type = history_list

[perf_model/nuca]
enabled = false

[perf_model/sync]
reschedule_cost = 0 # In nanoseconds

# This describes the various models used for the different networks on the core
[network]
# Valid Networks :
# 1) magic
# 2) emesh_hop_counter, emesh_hop_by_hop
# 3) bus
memory_model_1 = emesh_hop_counter
system_model = magic
collect_traffic_matrix = false

[network/emesh_hop_counter]
link_bandwidth = 64 # In bits/cycles
hop_latency = 2

[network/emesh_hop_by_hop]
link_bandwidth = 64   # In bits/cycle
hop_latency = 2       # In cycles
concentration = 1     # Number of cores per network stop
dimensions = 2        # Dimensions (1 for line/ring, 2 for 2-D mesh/torus)
wrap_around = false   # Use wrap-around links (false for line/mesh, true for ring/torus)
size = ""             # ":"-separated list of size for each dimension, default = auto

[network/emesh_hop_by_hop/queue_model]
enabled = true
type = history_list
[network/emesh_hop_by_hop/broadcast_tree]
enabled = false

[network/bus]
ignore_local_traffic = true # Do not count traffic between core and directory on the same tile

[network/bus/queue_model]
type=contention

[queue_model/basic]
moving_avg_enabled = true
moving_avg_window_size = 1024
moving_avg_type = arithmetic_mean

[queue_model/history_list]
# Uses the analytical model (if enabled) to calculate delay if cannot be calculated using the history list
max_list_size = 100
analytical_model_enabled = true

[queue_model/windowed_mg1]
window_size = 1000        # In ns. A few times the barrier quantum should be a good choice

[dvfs]
type = simple
transition_latency = 0 # In nanoseconds

[dvfs/simple]
cores_per_socket = 1

[bbv]
sampling = 0 # Defines N to skip X samples with X uniformely distributed between 0..2*N, so on average 1/N samples

[loop_tracer]
#base_address = 0 # Start address in hex (without 0x)
iter_start = 0
iter_count = 36

[osemu]
pthread_replace = false   # Emulate pthread_{mutex|cond|barrier} functions (false: user-space code is simulated, SYS_futex is emulated)
nprocs = 0                # Overwrite emulated get_nprocs() call (default: return simulated number of cores)
clock_replace = true      # Whether to replace gettimeofday() and friends to return simulated time rather than host wall time
time_start = 1337000000   # Simulator startup time ("time zero") for emulated gettimeofday()

[traceinput]
enabled = false
address_randomization = false # Randomize upper address bits on a per-application basis to avoid cache set contention when running multiple copies of the same trace
stop_with_first_app = true    # Simulation ends when first application ends (else: when last application ends)
restart_apps = false          # When stop_with_first_app=false, whether to restart applications until the longest-running app completes for the first time
mirror_output = false
trace_prefix = ""             # Disable trace file prefixes (for trace and response fifos) by default
num_runs = 1                  # Add 1 for warmup, etc

[scheduler]
type = pinned

[scheduler/pinned]
quantum = 1000000         # Scheduler quantum (round-robin for active threads on each core), in nanoseconds
core_mask = 1             # Mask of cores on which threads can be scheduled (default: 1, all cores)
interleaving = 1          # Interleaving of round-robin initial assignment (e.g. 2 => 0,2,4,6,1,3,5,7)

[scheduler/roaming]
quantum = 1000000         # Scheduler quantum (round-robin for active threads on each core), in nanoseconds
core_mask = 1             # Mask of cores on which threads can be scheduled (default: 1, all cores)

[scheduler/static]
core_mask = 1             # Mask of cores on which threads can be scheduled (default: 1, all cores)

[scheduler/big_small]
quantum = 1000000         # Scheduler quantum, in nanoseconds
debug = false

[hooks]
numscripts = 0

[fault_injection]
type = none
injector = none

[routine_tracer]
type = none

[instruction_tracer]
type = none

[sampling]
enabled = false
Cache source code evaluation
Files related to cache in Sniper config folder
gainestown.cfg contains the configuration of the L3 cache. The nesting contains the nehalem.cfg file
The nehalem.cfg file contains the configuration of L2 cache and L1 cache.
The default sniper argument is the gainestown.cfg file.
\sniper\commoncore\memory_subsystem Contains the definition and specific implementation of the storage system in sniper.
parametric_dram_directory_msi\cache_cntlr.cc
Determine if the current access cache misses or hits, if it is a hit to access cache (including write back and read cache), if the cache misses, then insert cache.
HitWhere::where_t
CacheCntlr::processMemOpFromCore(Core::lock_signal_t lock_signal,
Core::mem_op_t mem_op_type,IntPtr ca_address, UInt32 offset,
Byte* data_buf, UInt32 data_length,bool modeled,bool count);
/* Accepts a store access or a store write request, determines if the current cache access is hit or missing, and then calls a different processing function.  */
SharedCacheBlockInfo* CacheCntlr::insertCacheBlock(IntPtr address,
CacheState::cstate_t cstate, Byte* data_buf,
core_id_t requester, ShmemPerfModel::Thread_t thread_num);
/* This is called by the previous method when a cache misses. The main function is to find cache blocks to replace */
void CacheCntlr::accessCache(
Core::mem_op_t mem_op_type, IntPtr ca_address, UInt32 offset,
Byte* data_buf, UInt32 data_length, bool update_replacement);
/* The operation when the cache does not have a hit is also called by the processMemOpFromCore method. It consists of two main functions: read cache/write cache。 */
cache\cache.cc&cache.h
Each actual cache is defined as an object by the Cache class, such as L1-icache, which contains the basic information about the cache, including size, type, connectivity, and some operations to get the information. The cache class also includes two methods to access and insert the cache: accessSingleLine and insertSingleLine, both of which are called from CacheCntlr.
/* cache attributes */
// Cache counters
UInt64 m_num_accesses;
UInt64 m_num_hits;
// Generic Cache Info
cache_t m_cache_type;
CacheSet** m_sets;
CacheSetInfo* m_set_info;
/* cache constructor */
Cache(String name,String cfgname,core_id_t core_id,UInt32 num_sets,
UInt32 associativity, UInt32 cache_block_size,
String replacement_policy, cache_t cache_type,
hash_t hash = CacheBase::HASH_MASK,
FaultInjector *fault_injector = NULL,
AddressHomeLookup *ahl = NULL);
/* accessSingleLine: When a cache hit occurs, the Cache controller calls the accessCache method, which in turn calls this method in the cache class. This method reads and writes to the cache. */
CacheBlockInfo* accessSingleLine(IntPtr addr,
access_t access_type, Byte* buff, UInt32 bytes,
SubsecondTime now, bool update_replacement);
/* insertSingleLine: When cache misses, the Cache controller calls the insertCacheBlock method, where it further calls this method in the cache class.    */
void insertSingleLine(IntPtr addr, Byte* fill_buff,
bool* eviction, IntPtr* evict_addr,
CacheBlockInfo* evict_block_info, Byte* evict_buff,
SubsecondTime now, CacheCntlr *cntlr = NULL);
.\cache\cache_base.h
The CacheBase class includes some basic information about the cache, such as connectivity, cache size, and also includes some type definitions, such as replacement policy. It also includes some type definitions, such as replacement policy, which needs to be changed if a replacement algorithm is added.
enum ReplacementPolicy
{
ROUND_ROBIN = 0,LRU,LRU_QBS,
NRU,MRU,NMRU,PLRU,
SRRIP,SHCT_SRRIP,
SRRIP_QBS,RANDOM,
NUM_REPLACEMENT_POLICIES,SHCT_LRU
};//replace the enum type
cache\cache_set.cc和cache_set.h
The cache substitution algorithm is a set of cache lines in a group, the number of cache lines is the degree of connectivity. The substitution algorithm selects an appropriate cacheline in the group to be replaced. Each group is defined as an object by the CacheSet class, which includes more basic operations on cache. accessSingleLine method calls the read_line and write_line methods, and insertCacheBlock calls the insert method.
/* cache hit, used for data reading */
void read_line(UInt32 line_index, UInt32 offset, Byte *out_buff,
UInt32 bytes, bool update_replacement);
/*  cache hit, used for data writing back */
void write_line(UInt32 line_index, UInt32 offset, Byte *in_buff,
UInt32 bytes, bool update_replacement);
/*  cache miss, apply the agorithm to replace item in the cache  */
void insert(CacheBlockInfo* cache_block_info, Byte* fill_buff,
bool* eviction, CacheBlockInfo* evict_block_info,
Byte* evict_buff, CacheCntlr *cntlr = NULL);
In addition to the access methods for cacheset, the following two methods need to be changed if you need to add your own replacement algorithm.
/* Create corresponding cache_set objects depending on the replacement algorithm. */
CacheSet* CacheSet::createCacheSet(String cfgname, core_id_t
core_id,String replacement_policy,
CacheBase::cache_t cache_type,
UInt32 associativity, UInt32 blocksize,
CacheSetInfo* set_info);
/* Create corresponding cachesetinfo objects according to the replacement algorithm. */
CacheSetInfo* CacheSet::createCacheSetInfo(String name,
String cfgname, core_id_t core_id,
String replacement_policy, UInt32 associativity);
/* Determine the type of the substitution algorithm according to the input string of the substitution algorithm. */
CacheBase::ReplacementPolicy
CacheSet::parsePolicyType(String policy);
.\cache\cache_block_info.cc&cache_block_info.h
Each cacheline will have an object created by the class cacheBlockInfo to hold additional information about the cache line, such as tag bits, used bits, etc. If the addition of a replacement algorithm requires additional information, consider adding it in this place or in the previous layer of cacheset.
IntPtr m_tag;
CacheState::cstate_t m_cstate;
UInt64 m_owner;
BitsUsedType m_used;
UInt8 m_options;
// large enough to hold a bitfield for all available option_t's
.\cache\cache_set_lru.cc和cache_set_lru.h
The lru algorithm that comes with sniper, whose base classes are both cacheset classes, implements the getReplacementIndex method and updateReplacementIndex method of the base class. The former is used to select the appropriate cache line to be replaced when looking for a replacement cache line, according to the algorithm that determines the replacement. The latter is used for the update operation that the replacement algorithm needs to perform when a certain cache line is accessed (read, write back, insert) (updating itself with additional information, such as the LRU access record).
clflush
clflush is often executed when a hacker is carrying out the spectre attack. Invalidates from every level of the cache hierarchy in the cache coherence domain the cache line that contains the linear address specified with the memory operand. If that cache line contains modified data at any level of the cache hierarchy, that data is written back to memory. The source operand is a byte memory location. The semantics is defined below:
flush Cache Line
Opcode / Instruction
Op/En
64-bit Mode
Compat/Leg Mode
Description
NP 0F AE /7 CLFLUSH m8
M
Valid
Valid
Flushes cache line containing m8.
Instruction Operand Encoding
Op/En
Operand 1
Operand 2
Operand 3
Operand 4
M
ModRM:r/m (w)
NA
NA
NA
CLFLUSH operation is the same in non-64-bit modes and 64-bit modes.
Operation
Flush_Cache_Line(SRC);
Intel C/C++ Compiler Intrinsic Equivalents
void _mm_clflush(void const *p)
Protected Mode Exceptions
#GP(0)
For an illegal memory operand effective address in the CS, DS, ES, FS or GS segments.
#SS(0)
For an illegal address in the SS segment.
#PF(fault-code)
For a page fault.
#UD
If CPUID.01H:EDX.CLFSH[bit 19] = 0.
If the LOCK prefix is used.
Real-Address Mode Exceptions
#GP
If any part of the operand lies outside the effective address space from 0 to FFFFH.
#UD
If CPUID.01H:EDX.CLFSH[bit 19] = 0.
If the LOCK prefix is used.
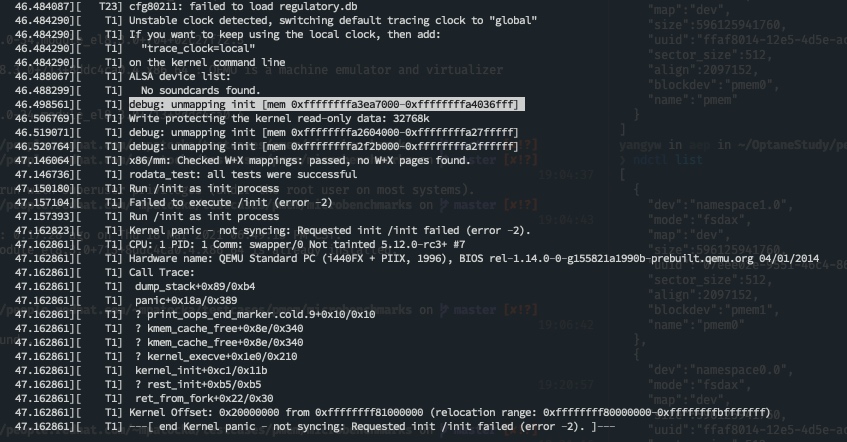
The Process of finding the execution point
It’s hard first to execute the code just with the static analysis. So it’s natural to utilize gdb just with option --gdb on for run_sniper. However, the sift requires the thread synchronization but gdb is hard to make all thread synchronized. So I gave up. First browsing the code, I found function void PerformanceModel::queueInstruction(DynamicInstruction *ins) which first padding the code into a queue and simulate them with the iterator.
void PerformanceModel::iterate()
{
   while (m_instruction_queue.size() > 0)
   {
      // While the functional thread is waiting because of clock skew minimization, wait here as well
      #ifdef ENABLE_PERF_MODEL_OWN_THREAD
      while(m_hold)
         sched_yield();
      #endif
      DynamicInstruction *ins = m_instruction_queue.front();
      LOG_ASSERT_ERROR(!ins->instruction->isIdle(), "Idle instructions should not make it here!");
      if (!m_fastforward && m_enabled){
         handleInstruction(ins);
      }
      delete ins;
      m_instruction_queue.pop();
   }
   synchronize();
}
The instruction is dispatched there. So I first printf("sb"); to test whether it can be interleaved inside the instruction. The result is yes, but so many sbs, around a thousand both even before the program begins and after the program shuts. My guess is that the emulator has the init.S for OS booting, and some C runtime loaded in the first place. And clflush should be selected from other syscalls.
So our problem converted to how to identify the 4 clflush from other syscalls. First, I did’t find the identifier as my code in the riscv simulator. Then, I found ins has a lot of identifiers:
We first found how Instruction size for identifier, but other than clflush, there’s other instructions of size of 9. Then we got meminfo, take meminfo->addr, but it’s changeable every run. Then we found something for identifier well, that is opcode, which unique to every ISA. Their code section is quite different.
Indirect next_state function: “here’s how to compute next state”
Slower ... but can do complex instructions
Multi-cycle execution (of control)
Hardwired control
Implemented using logic (“hardwired” can’t re-program)
Direct next_state function: “here is the next state”
Faster ... for simple instructions (speed is function of complexity)
Single-cycle execution (of control)
Why Microcode
How RISC to CISC and then to RISC
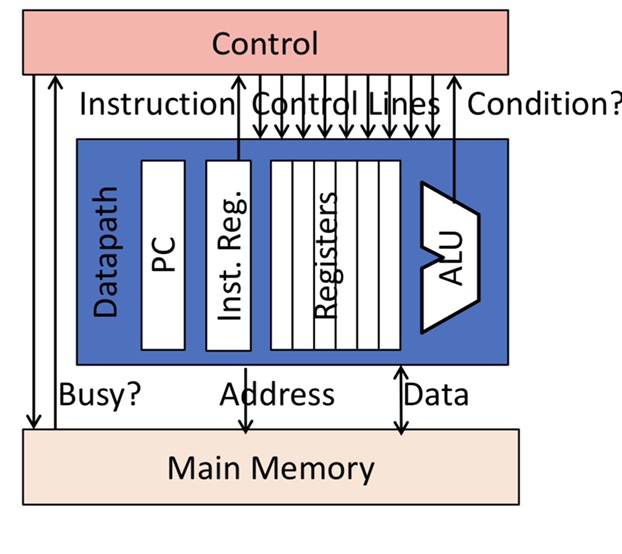
Control vs. Datapath
control can be split between datapath, where numbers are stored and arithmetic operations computed and control, which sequences operations on datapath.
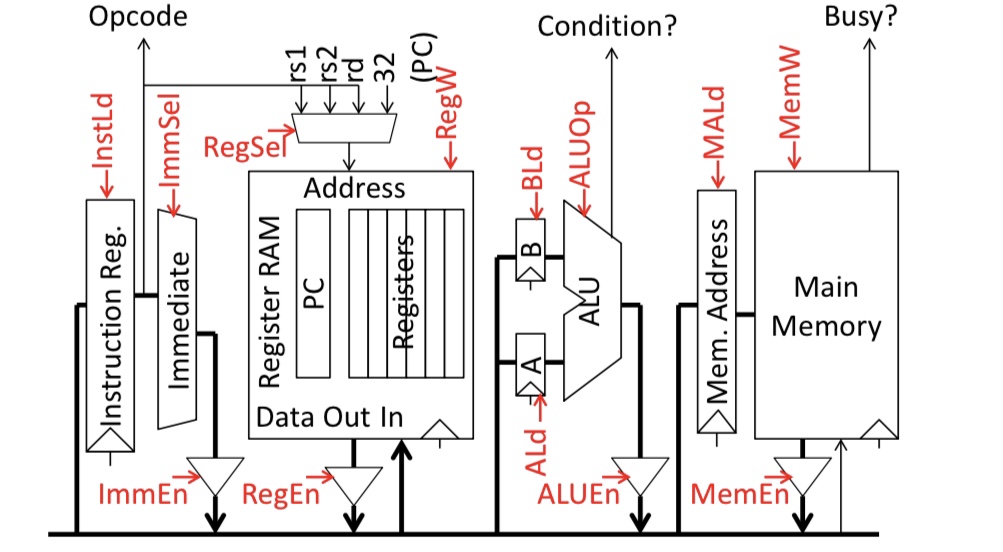
Single-Bus Datapath for Mircrocoded RISC-V
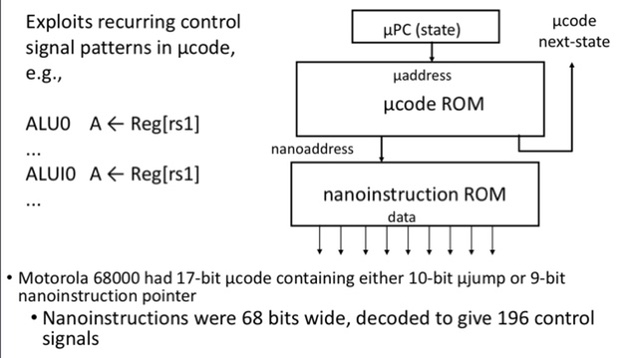
Microinstructions written as register transfers:
MA:=PC means RegSel=PC; RegW=0; RegEn=1; MALd=1
B:=Reg[rs2] means RegSel=rs2; RegW=0; RegEn=1; BLd=1
Reg[rd]:=A+B means ALUop=Add; ALUEn=1; RegSel=rd; RegW=1
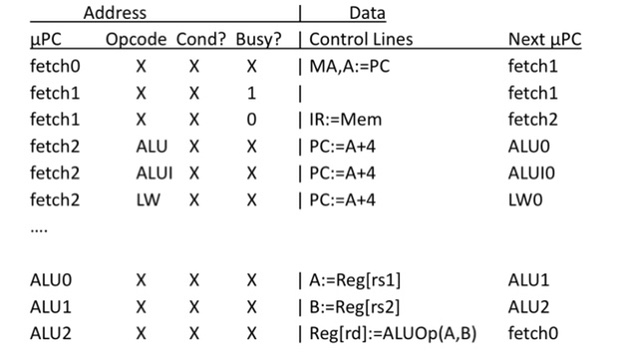
Microcode Sketches
Instruction Fetch:
MA,A:=PC
PC:=A+4
wait for memory
IR:=Mem
dispatch on opcode
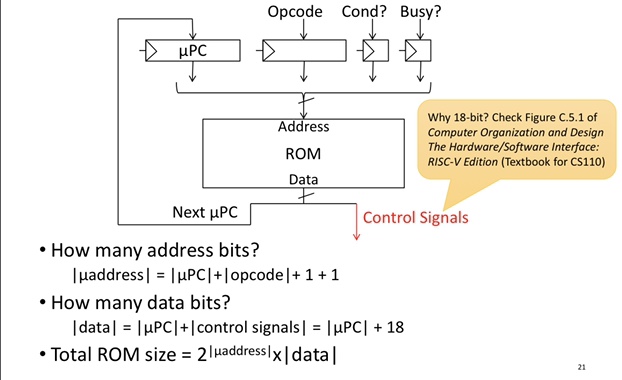
Pure Rom Implementation
Instruction fetch sequence 3 common steps
~12 instruction groups
Each group takes ~5 steps (1 for dispatch)
Total steps 3+12*5 = 63, needs 6 bits for µPC
Opcode is 5 bits, ~18 control signals
Total size = \(2^{6+5+2}*(6+18)=2^{13}*24 = ~25KiB\)!
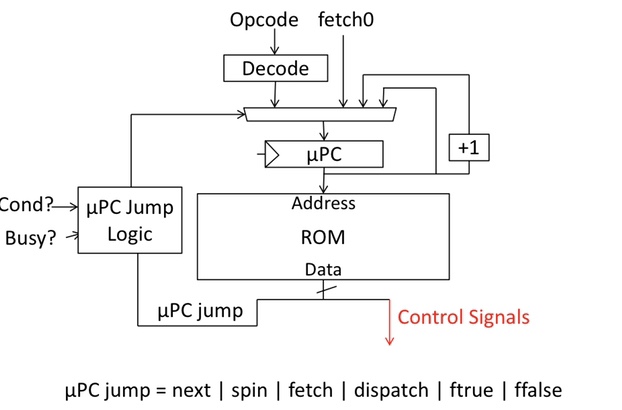
Reduce Control Store Size
Reduce ROM height (#address bits)
Use external logic to combine input signals
Reduce #states by grouping opcodes
Reduce ROM width (#data bits)
Restrict µPC encoding (next, dispatch, wait on memory, …)
Encode control signals (vertical µcoding, nanocoding)
Microcoded r Hardcoded -> Hardwired
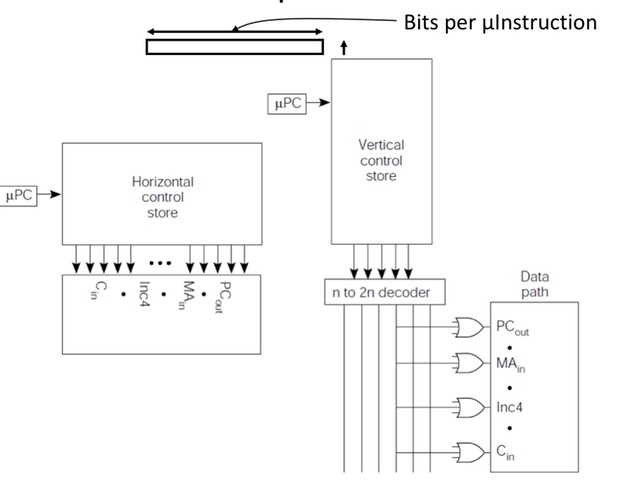
Horizontal vs. Vertical µCode
Horizontal µcode has wider µinstructions
Multiple parallel operations per µinstruction
Fewer microcode steps per macroinstruction
Sparser encoding ⇒ more bits
Vertical µcode has narrower µinstructions
Typically a single datapath operation per µinstruction
separate µinstruction for branches
More microcode steps per macroinstruction
More compact ⇒ less bits but requires more capability of paralization
Nanocoding
Tries to combine best of horizontal and vertical µcode

 Basically, based on the predefined rules, the co-processor is able to fuse most of the data operations like LevelDB CRC, open read-write close.
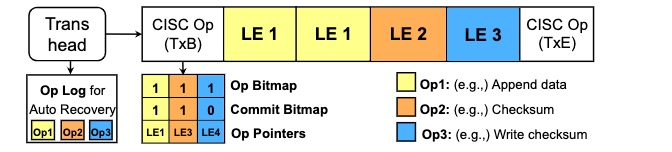
 I'm curious why not implement the SSD main controller? It's meaningless to write on NVM because programmers must do handmade I/O fusion on such devices.
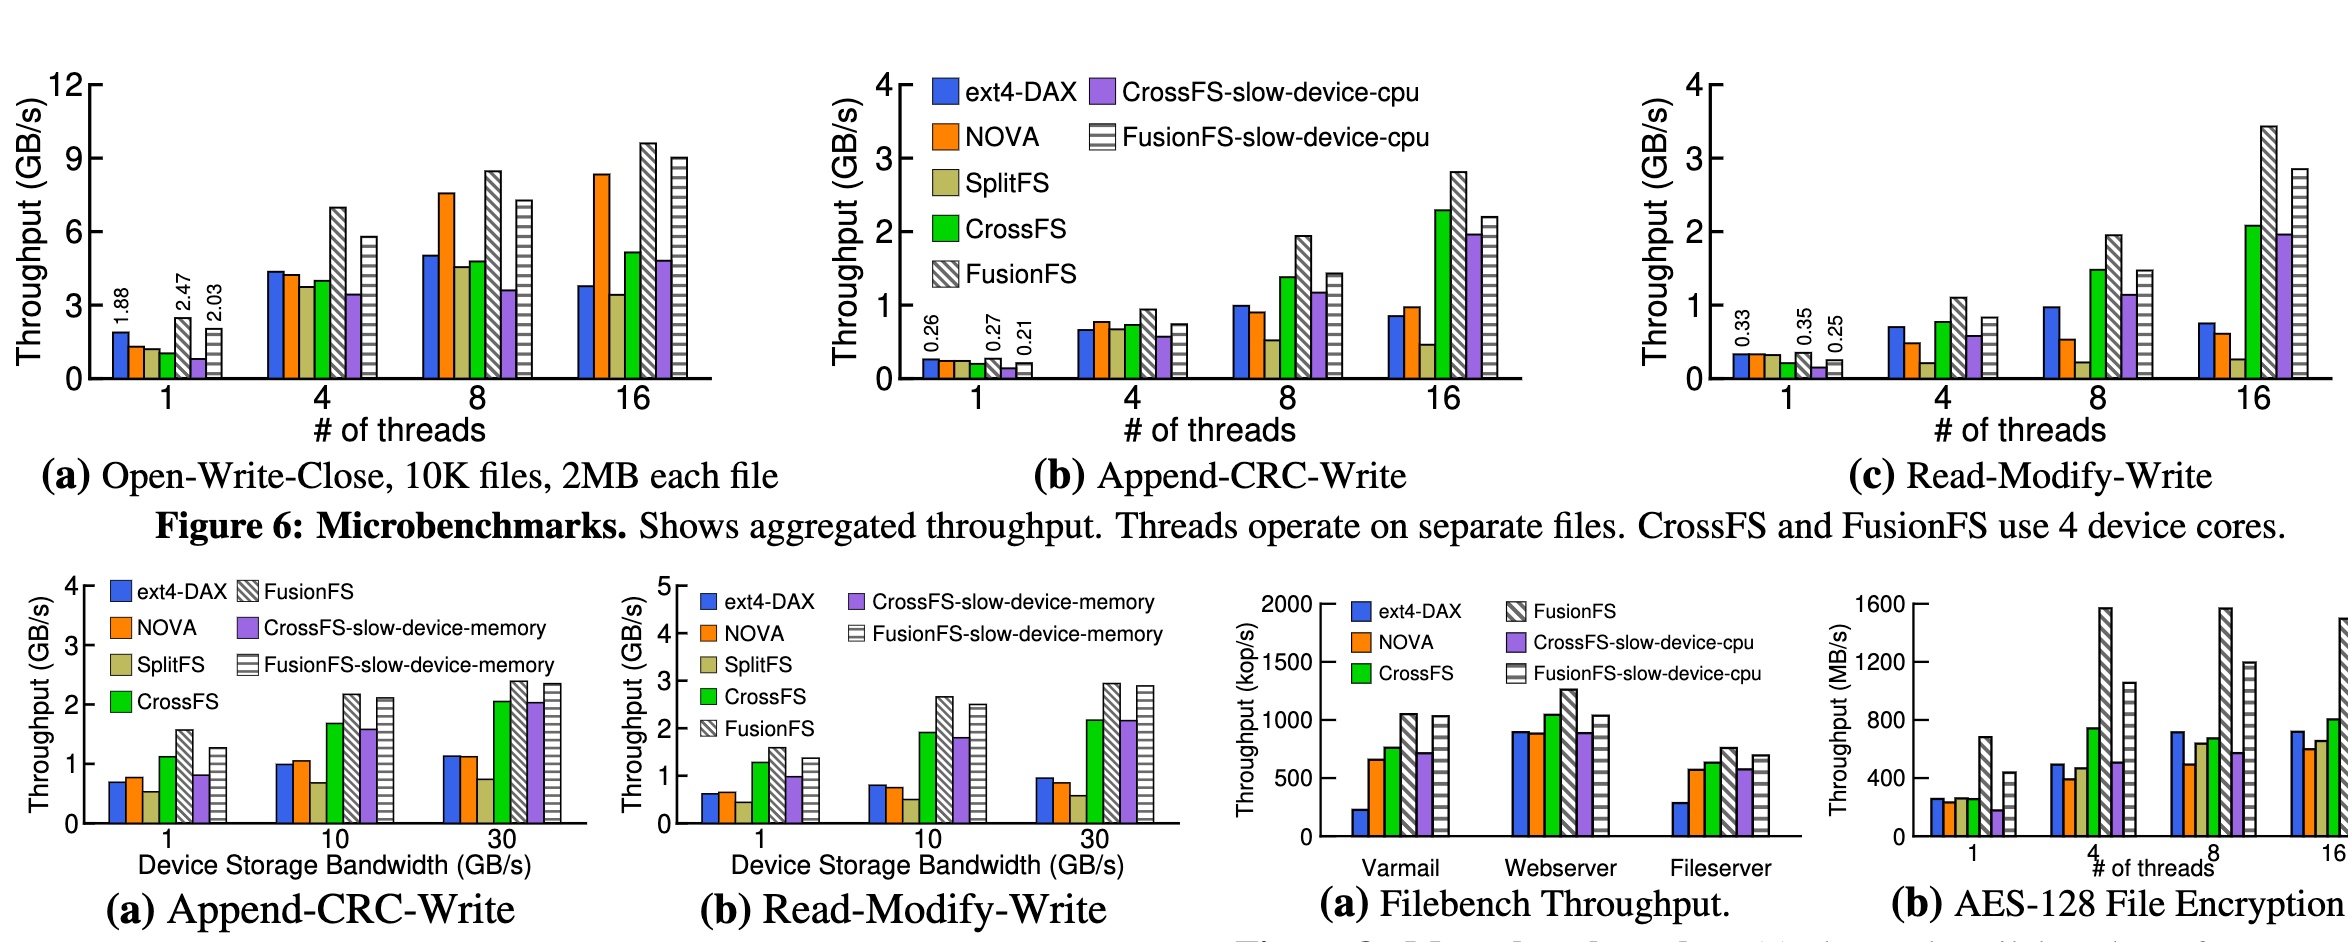 Performance is roughly the same with NOVA when with slow device CPU. I don't know if IO thread affinity and other kernel optimization are applied, the additional hardware has real benefits. However, the recovery speed is really quick because of MicroTx.