Carbink

The comparison between RMA based memory disaggregation and CXL.mem based memory disaggregation.

The span+coherency state in Carbink is just like cacheline coherency in CXL.mem but except that if two threads contention on one span it will go back and forth, that's the charm of cachable that CXL don't need the cacheline be transmitted but they are registered in the window of local LLC.

A lot of the software optimization is based on the panelty of small chunks transmission of RDMA is too huge that if we replace with CXL, we don't need to care ptr serialization and relinking because they are in the same memory space. maintaining a metadata of pages is still a huge overhead. The local page map is a two-level radix tree. The lookup process is similar to a page table walk: the first 20 bits of the object's virtual address are indexed to the first level radix tree table, and the next 15 bits are indexed to the second level table. The same mapping method allows Carbink to map the virtual address of a locally-resident span to its metadata. Thus this paper in era of CXL is useless, nothing to refer.

The difference of EC-Split(their implementation of Hydra) and EC-Batch is the critical path of the memory transaction. To reconstruct a single span, a compute node must contact multiple memory nodes to pull in all the required fragments. This requirement to contact multiple memory nodes makes the swap operation vulnerable to deviators, thus increasing the tail latency. And their compaction and de-fragmentation approach is to save the remote data usage but has no upgain for performance actually for their local vs remote upper than 50%. They only gain 10% for more on local side by the hiding of the span swap operations.

Reference

  1. https://www.usenix.org/conference/osdi22/presentation/zhou-yang
  2. https://www.google.com/search?q=hydra+fast+21&oq=hydra+fast+21&aqs=chrome..69i57j33i299l3j33i22i29i30i625l6.4597j1j4&sourceid=chrome&ie=UTF-8

WebAssembly Micro Runtime Internals

This doc is frequently updated.

I'm looking into the design of WAMR because this fits the heterogeneous device migration.

Interperter vs. AOT vs. JIT

  • Interpreter has 2-5x slow down.
  • AOT and JIT have a near-native slowdown, but JIT has load time compilation which takes time. If the program is long enough, load time doesn't care.

Interpreter

The interpreter mode has two modes; the main difference between classic and fast is the handle table and indirect jump; they make it cache-friendly.

AOT and JIT

Fast JIT is a lightweight implementation that has the auxiliary stack for interp frame. But has 50%-80% performance of LLVM JIT.

Basically, they share the same LLVM infrastructure, but AOT has more internal states that have been updated pretty well with a struct name starting with AOT*. AOT has a standalone compiler called wamrc for compiling the bytecode to AOT Module. On loading the program, AOT will load into the LLVM section and update the struct. JIT will not be called out, but they will call the same memory instance.

; ModuleID = 'WASM Module'
source_filename = "WASM Module"

define void @"aot_func#0"(i8** %e) {
f:
  %a = getelementptr inbounds i8*, i8** %e, i32 2
  %a1 = load i8*, i8** %a, align 8
  %c = getelementptr inbounds i8, i8* %a1, i32 104
  %f2 = getelementptr inbounds i8, i8* %a1, i32 40
  %f3 = bitcast i8* %f2 to i8**
  %f4 = load i8*, i8** %f3, align 8
  %f5 = bitcast i8* %f4 to i8**
  br label %f6

f6:                                               ; preds = %f
  ret void
}

define void @"aot_func#0_wrapper"() {
f:
  ret void
}

We will lose the symbol for the function generation without the debug symbol. But they have a definition of dwarf for wasm specifically, which WAMR implemented on load.
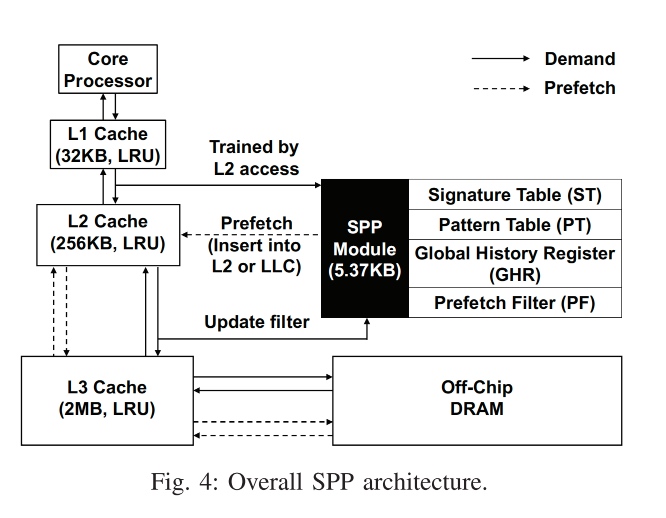
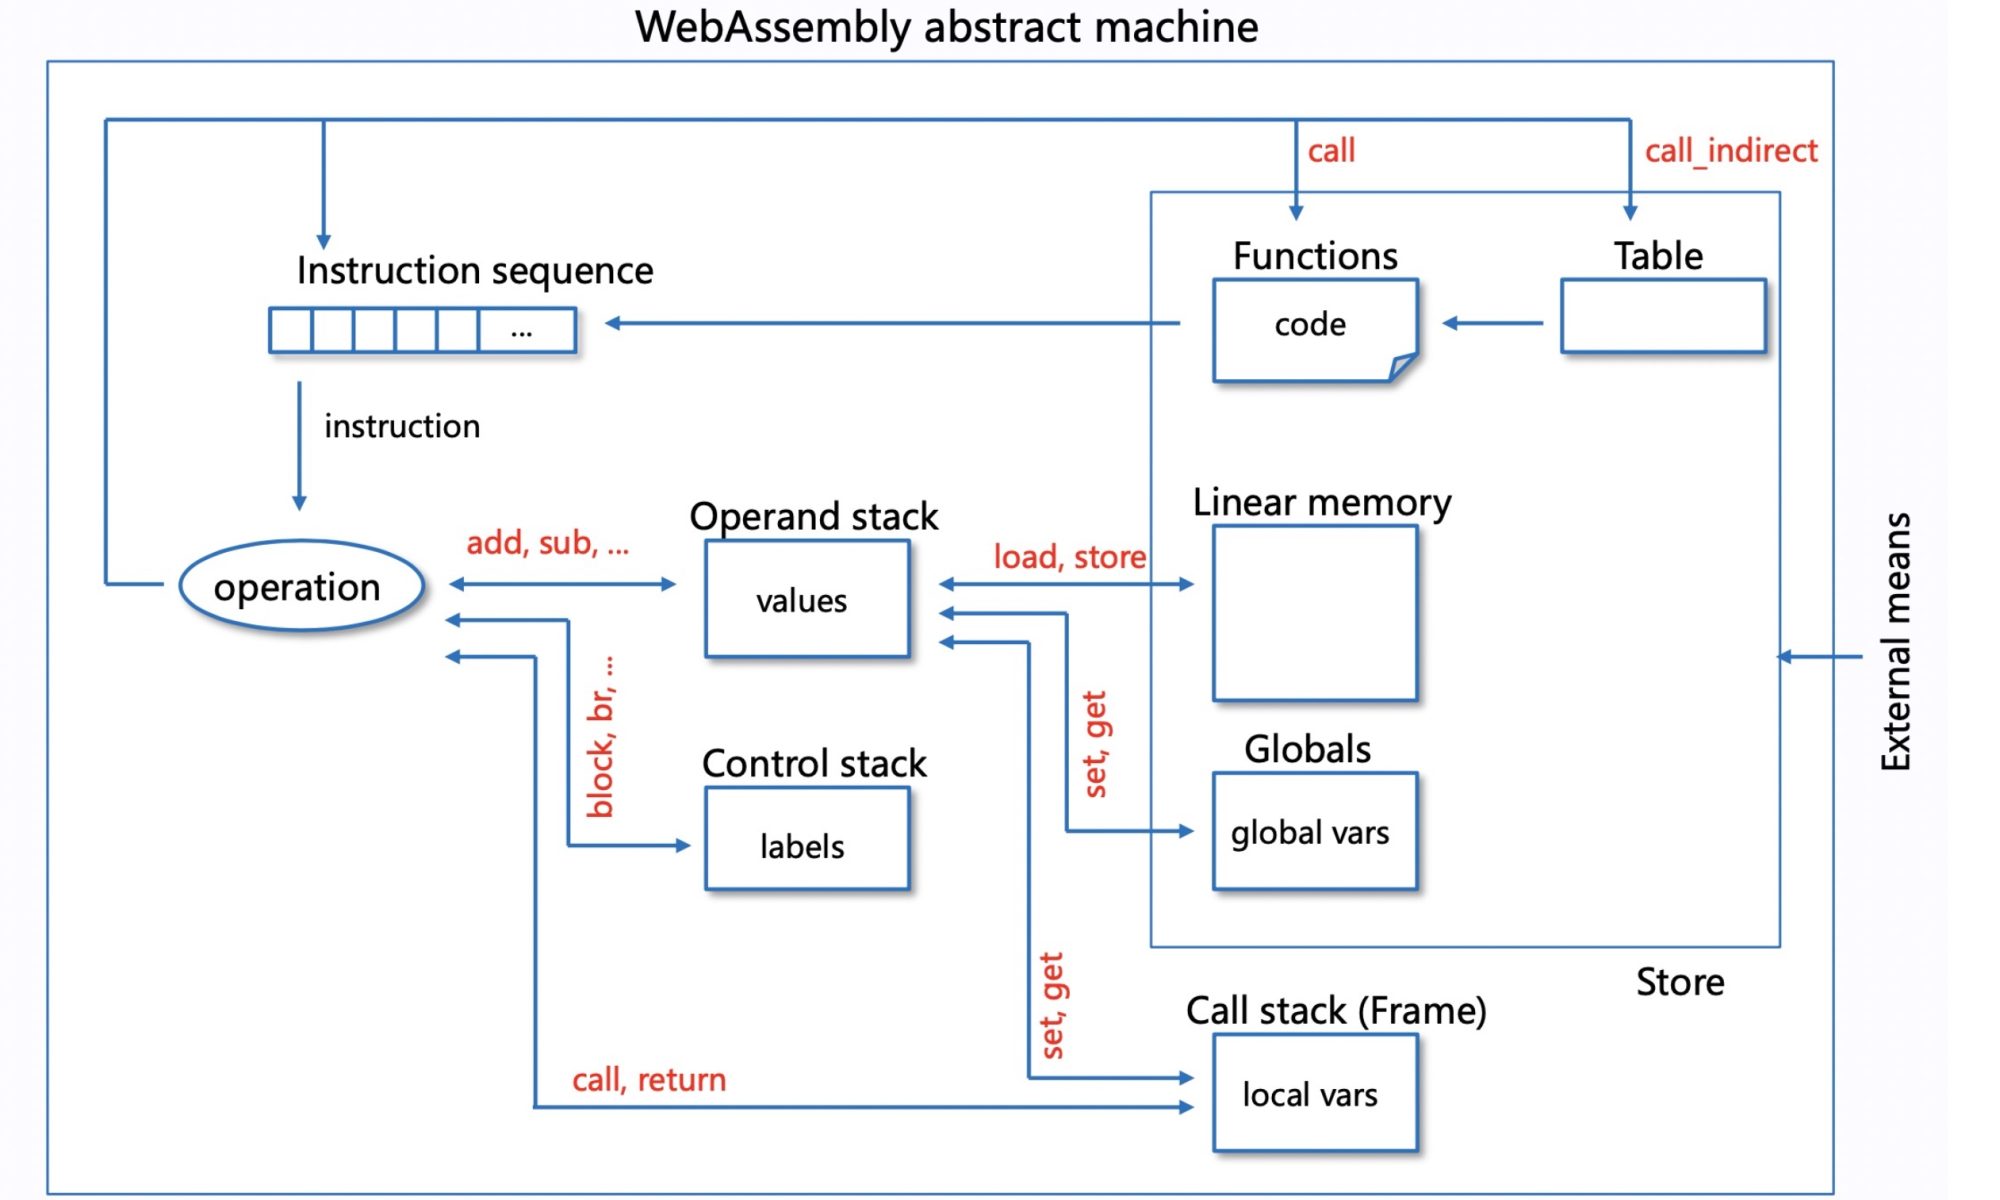
Abstract machine


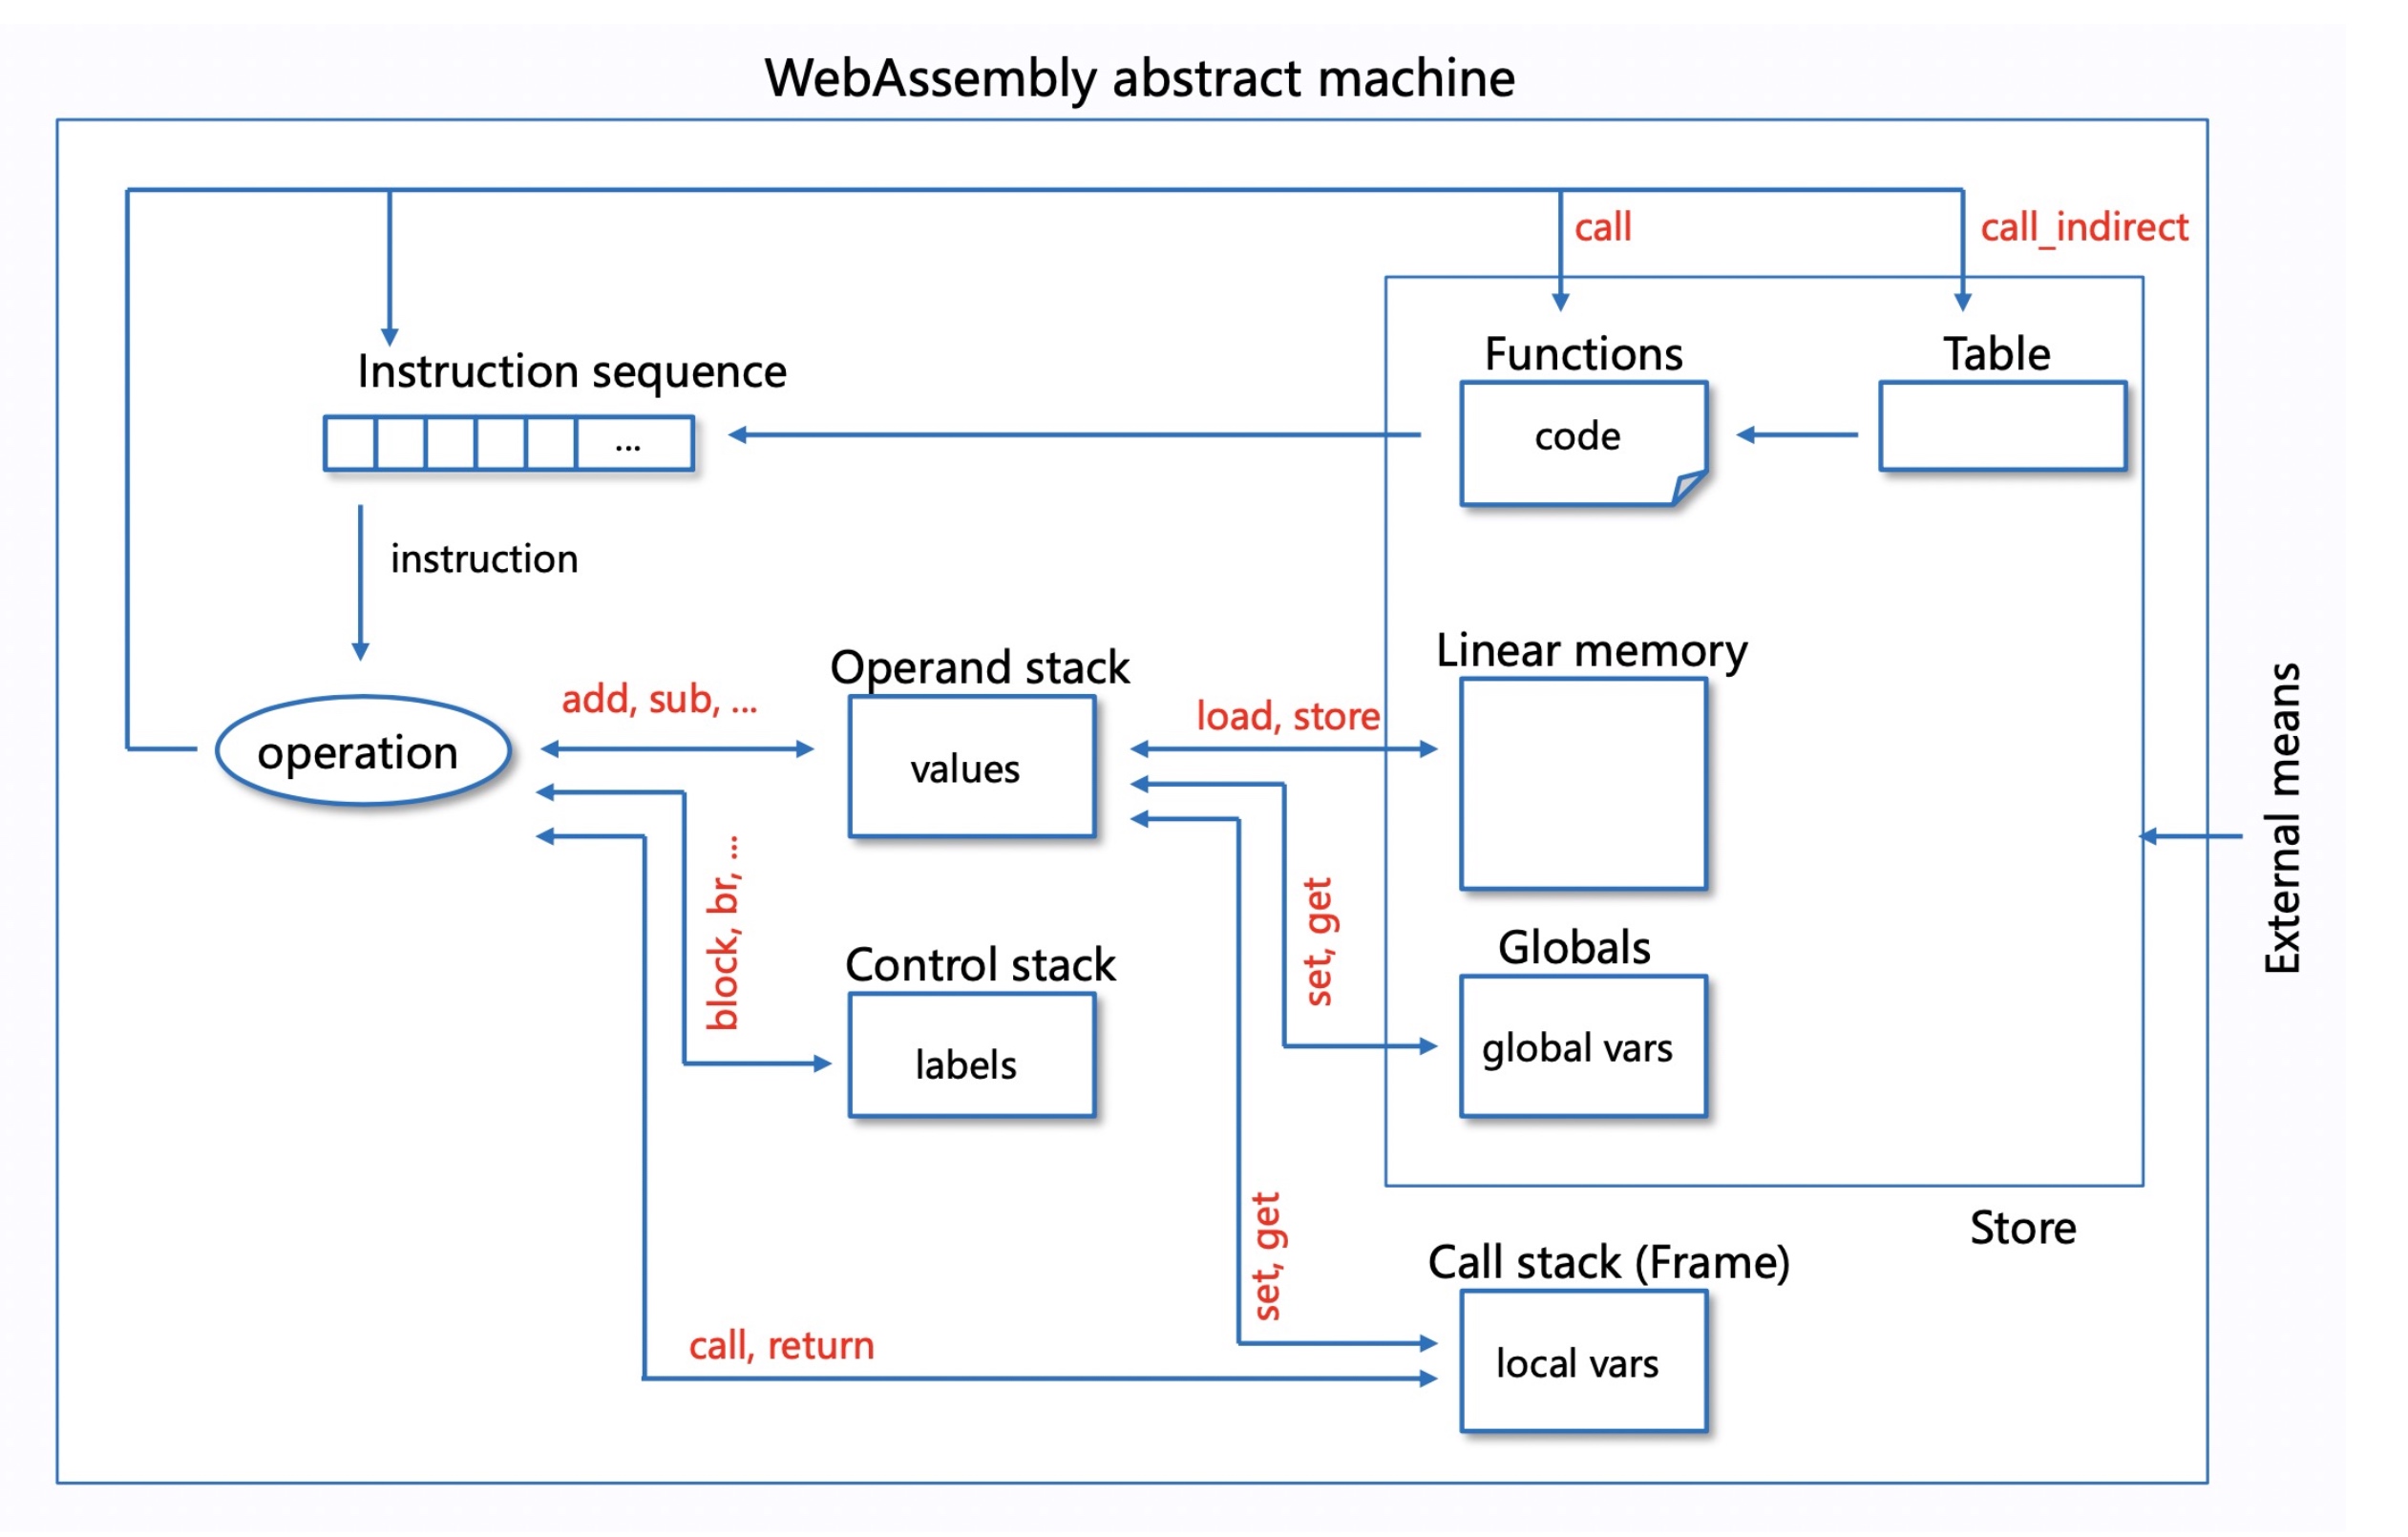
For Interpreter and AOT, every step has a state of every component stored at the C++ language level.

Memory

First, init with memory allocation on options.

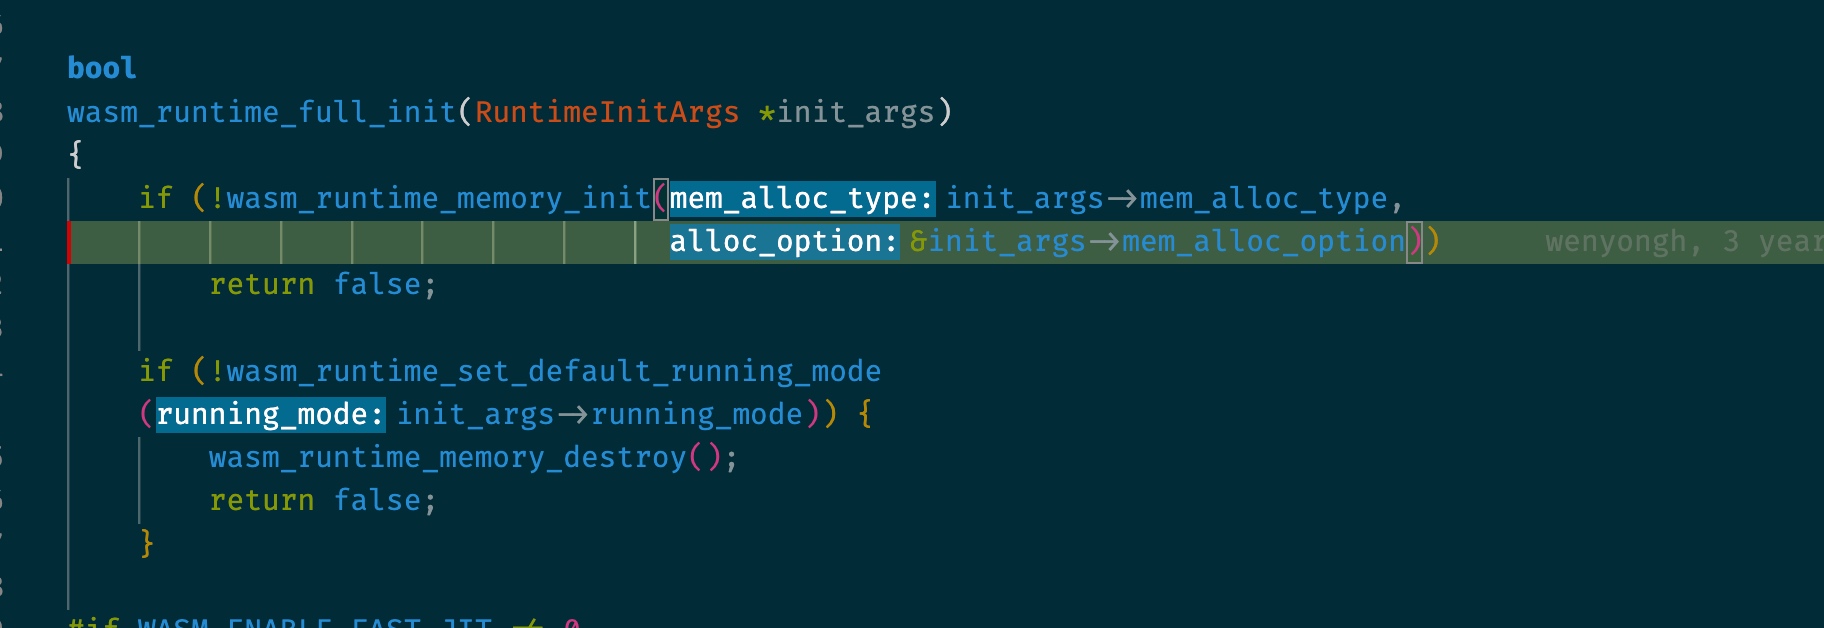
You can define the memory serialized data section in the same place and first initialize them into desired memory format.

RuntimeInitArgs wasm_args;
memset(&wasm_args, 0, sizeof(RuntimeInitArgs));
wasm_args.mem_alloc_type = Alloc_With_Allocator;
wasm_args.mem_alloc_option.allocator.malloc_func = ((void *)malloc);
wasm_args.mem_alloc_option.allocator.realloc_func = ((void *)realloc);
wasm_args.mem_alloc_option.allocator.free_func = ((void *)free);
wasm_args.max_thread_num = 16;
if(!is_jit)
    wasm_args.running_mode = RunningMode::Mode_Interp;
else
    wasm_args.running_mode = RunningMode::Mode_LLVM_JIT;
//    wasm_args.mem_alloc_type = Alloc_With_Pool;
//    wasm_args.mem_alloc_option.pool.heap_buf = global_heap_buf;
//    wasm_args.mem_alloc_option.pool.heap_size = sizeof(global_heap_buf);

OS Bound Check does, from stack bottom to top, iterate to check whether is overflow every time access. as it was hardware accelerated by Flexible Hardware-Assisted In-Process Isolation with HFI

6. Pluggable Runtime Components

6.1 WASI (WebAssembly System Interface)

  • Implements file descriptors (0/1/2), preopens directories, and basic I/O syscalls.
  • On instantiation, _start→wasm_call_ctors populates fd_app[] and ntwritten[].

6.2 WASI-nn (Neural Network)

  • Provides a minimal ABI for invoking TFLite inference.
  • Backend-agnostic: hook in CPU, GPU, or NPU kernels.
cpp


å¤åˆ¶ē¼–č¾‘
struct WAMRWASINNContext {
  bool is_initialized;
  GraphEncoding current_encoding;
  uint32_t current_models;
  Model    models[MAX_GRAPHS_PER_INST];
  uint32_t current_interpreters;
  Interpreter interpreters[MAX_GRAPH_EXEC_CONTEXTS_PER_INST];
};

6.3 WASI-crypto

  • Exposes standard cryptographic primitives (SHA, AES, RSA) via host calls.

6.4 WASI-socket

  • Experimental socket API for TCP/UDP communication in constrained environments.

6.5 WASI-pthread

  • Lightweight pthreads over host threads or fiber emulation, enabling multithreaded Wasm modules.

7. References

Reference

  1. https://tfhub.dev/tensorflow/bert_en_uncased_L-12_H-768_A-12/4
  2. https://github.com/faasm/faasm
  3. https://robot9.me/webassembly-threaded-code/

R2: An Application-Level Kernel for Record and Replay

When I reviewed the paper in the past, I was surprised that the recently proposed plans like JIT, MLIR, and eBPF could be a great fit for the legacy tools like record and replay and security live patching or kernel modeling.

Reference

  1. https://www.usenix.org/legacy/event/osdi08/tech/full_papers/guo/guo.pdf
  2. https://nimrodpar.github.io/assets/publications/rr.pdf
  3. https://iacoma.cs.uiuc.edu/iacoma-papers/hpca18.pdf

Failure Tolerant Training with Persistent Memory Disaggregation over CXL

The auto-flushing-persistently from GPU to PMEM without serializing the GPU memory makes it the greatest in snapshotting or swapping. When I was rewriting QuEST in ASC 21-22, we found that Tsinghua University Zhangcheng and NUDT is doing swapping memory back and forth to make it possible to emulate more QuBits. This arch will be a best fit for that.

Their story is a recommendation system that the embedding table could not fit in a single card and disaggregate the GPU memory illustration of the embedding table to other CXL2.0 devices.


So still taking the memory as an outer device but not integrating the fault tolerance into the protocol level to make sure the single node fault tolerance. Still, it's a pure hardware stack implemented software check-pointing idea. Way brute forcing and nontransferable to other workloads. The flag and MLP unique features augmented is the basic idea of write log we were researching on the persistent memory file systems.


Their emulation platform is ... I'm shocked... The GPU emulation is Vortex. They don't actually need both the GPU and CPU to support the CXL controller interface. They just want to make cacheline shared in the CXl pool between Intel Optane and GPU. However, I think this kind of emulation is not accurate enough for CPU internal cacheline mechanism.

Reference

  1. https://ieeexplore.ieee.org/stamp/stamp.jsp?tp=&arnumber=10018233&tag=1
  2. https://arxiv.org/pdf/2301.07492.pdf

PMU Change in Saphire Rapids

This document will be updated in wiki

  1. CCD interconnect Metrics
    1. Since the interconnect of the CCDs is EMIB, and the cache coherency is still directory routing from LLC to HBM and Memory, the PMU has operands DRd/CRd and abstraction of TOR and IA to record the metrics.
    2. All CHA Uncore PMU starts with UNC_CHA_TOR_INSERTS, those can be labeled as CHA tile 0x2000-0x2180 for a 23-core machine, which maps to each tile's 2/3/4/5 are control registers and 8/9/a/b are result registers. It's easy to get cha id mapping to os id through unc memory bandwidth write.
    3. Every local CCD mesh has 3 UPIs, 3 memory port and 1 PCIe &CXL port. There are three types of traffic IIO/PCIe&CXL/UPI. From 0x3000-0x30b0, Only 1 has value(because there's no PCIe device attached) on my machine for PCIe1-4 IIO 1-4, which has 4 control registers, which maps to each tile's 2/3/4/5 are control register and 8/9/a/b are result registers. From 0x3400-0x34b0, there are only 6 values one my machine, which I think should be UPI and iMC ports. All of those only have 2 control registers, 2/3 are control registers and 8/9 are result registers.
  2. CXL Traffic Metrics
    1. I think the current PMU is not fully renamed to the CXL.cache but embedded in the core's metrics, like hitm, miss snoop_none, etc.
    2. OCR.READS_TO_CORE.L3_MISS_LOCAL_SOCKET. This metric will count all the code read and RFO that miss the L3 but request to local CXL Type 2 or private DRAM. Remote requests will count toward the remote counterpart metric.
  3. Some guesses
    1. HBM2E serves as a non-inclusive directory-based directly mapped L4 cache(manifested as HBM M2M(mesh to memory) blocks and EDC/HBM channels) like persistent memory using the extra tag for caching. It can cache some of the CXL.cache requests if LLC each CCD is not big enough.
    2. AMD supports CXL2.0's RAS and gpf, while Intel gives it up because 1. gpf is useless, 2. it's the outer fabric manager's work, and intel puts the efforts into vendors.

Reference

  1. https://zhuanlan.zhihu.com/p/598702329
  2. https://perfmon-events.intel.com/index.html?pltfrm=ahybrid.html&evnt=OCR.DEMAND_DATA_RD.L3_MISS

Micro-architectural Analysis of OLAP: Limitations and Opportunities

To understand the OLAP's runtime PMU metrics, how should it be a paper that's published on PVLDB. And also a PM evaluation also by Bytedance.

The in-memory OLTP has greatly studied a lot for Cache misses, especially hitm; my previous blog gives my experiment on TPCH over MonetDB, and Postgresql is not DRAM Bandwidth bound. It amazed me that a reference to remote NUMA memory should cause such a bound. The paper discusses only the scan-intensive queries with multiple cores that can hit the memory bound. join-intensive queries suffer from latency-bounded data cache stalls.

The OLAP differs from the transaction-based database; most of them have vectorized-based query planer and online analysis codegen. We may look at the velox and arrowdb.

The breakdowns of CPU cycles in both single-thread execution and multi-thread execution. They affine the memory only on one NUMA socket and fully disable the prefetcher. We see that the scalability of DMBS C is good enough, while other DB has deterioration for multithread.

Normalized response time breakdowns for Quickstep when it runs the large join micro-benchmark query, as single-threaded, w/wo using Filter Join

Only the Multi-thread will hit the bandwidth bound.
g)

TCUDB: Accelerating Database with Tensor Processors

Running Database on GPU tensor computing unit(TCU).

Claim

  1. The partitioned hash join algorithm in a non-matrix-friendly manner is hard to rewrite on TCU
  2. The underlying data movement requires different data organization.
  3. TCU is mostly int8 or fp16, which are not accurate enough.

The key-value hash map data storage has cuckoo hashing in GPU; the data storage can refer to such Memory management; the insight is how to accelerate every operator with optimizer and codegen to matmul that can make use of GPU.

Also, because the single GPU's VRAM is typically smaller than CPU's private DRAM, we need the wss estimation for wh11ether the CPU or GPU plan. They use MSplitGEMM to test the working set size with is the upper bound of the VRAM occupation.


Supported query planner


The query planner has UNCOMPRESSED/COMPRESSED MEM/PINNED/MMAP and some movement assessment for whether compress or do the migration to CPU.

Their compressed data means the data is stored in a cuckoo hashing manner.

The Matrix Multiplication, Entity Matching, and PageRank have better performance because they leverage the online storage of GPU VRAM.

The fault tolerance of the GPU's data cannot be guaranteed; for more functionality, I think it still requires the DPU to store or disaggregate GPU VRAM to Memory Expander.

IndexPolicy, ReplacementPolicy, and Entry in Gem5 explanation

All the variable is SimObj in Gem5. For instance, the SignaturePath Prefetcher is an instance of QueuedPrefetcher, The parameter to instantiate the object is passed with

struct SignaturePathPrefetcherParams
    : public QueuedPrefetcherParams
{
    gem5::prefetch::SignaturePath * create() const;
    double lookahead_confidence_threshold;
    uint8_t num_counter_bits;
    unsigned pattern_table_assoc;
    uint64_t pattern_table_entries;
    gem5::BaseIndexingPolicy * pattern_table_indexing_policy;
    gem5::replacement_policy::Base * pattern_table_replacement_policy;
    double prefetch_confidence_threshold;
    uint16_t signature_bits;
    uint8_t signature_shift;
    unsigned signature_table_assoc;
    uint64_t signature_table_entries;
    gem5::BaseIndexingPolicy * signature_table_indexing_policy;
    gem5::replacement_policy::Base * signature_table_replacement_policy;
    unsigned strides_per_pattern_entry;
};

Because there are actually 3 entries defined in SPPPrefetcher, the version 2 of SPP add the Global History Register Table, every time you accessed the prefetcher, say grabbing information from L2 access info, is adding an entry in these three tables. And the timing of fetching is during the pipeline fetching the data.


The associativity of the table inside SPPPrefetcher is always 1. So the Base IndexPolicy is too tooo toooo overly enculpsion for this prefetcher.

The BaseIndexPolicy is every time you access the entry, the AssociativeSet will initialize a set resides the vector you access, say a TaggedEntry that uses the address as a tag, it will also initialize the ReplcamentPolicy basically requiring the entry vector and pattern vector. every time find a victim will call the replacement policy and call LRU to evict the victim. I will do it using a lambda function over vector view.